Production RAG · Part 5 of 9
Images and Multimodal Retrieval
Contents
Text retrieval works because both sides of the comparison are text living in one embedding space. An image breaks that symmetry, and the way you restore it is one of the few RAG decisions that is genuinely hard to reverse later. It is also the decision where the cheapest-looking option is usually the expensive one, for a reason that only becomes visible when you separate one-time costs from recurring ones.
Disclaimer. This post is drafted with assistance from large language models (Claude Opus 4.8 and DeepSeek V4 Pro) based on conversations exploring production RAG concepts. All content has been reviewed, edited, and verified by a human author.
Two architectures
| Approach | How it works | Trade-off |
|---|---|---|
| Multimodal embeddings | One model maps text and images into a shared space; query text lands near relevant images | Elegant — but every downstream question needs a vision-capable model re-reading pixels |
| Summarize then index | A vision model describes the image once at ingest; the description is embedded as ordinary text | Two model calls at ingest; downstream, everything is text |
If your corpus is mostly tables screenshotted into PDFs — which describes an enormous amount of real enterprise documentation — summarize-then-index deserves a stronger twist. Do not write a description; write a full transcription, as
Header: value | Header: valuerows. A description tells you what a table is about. A transcription lets you answer from it without ever looking at pixels again.
The third architecture: late interaction
A third variant is rising: embed entire rendered pages with late-interaction models in the ColPali family, and hand the page images to a multimodal LLM at answer time. Late refers to when the query and the page are first allowed to touch — not to anything late in the model.
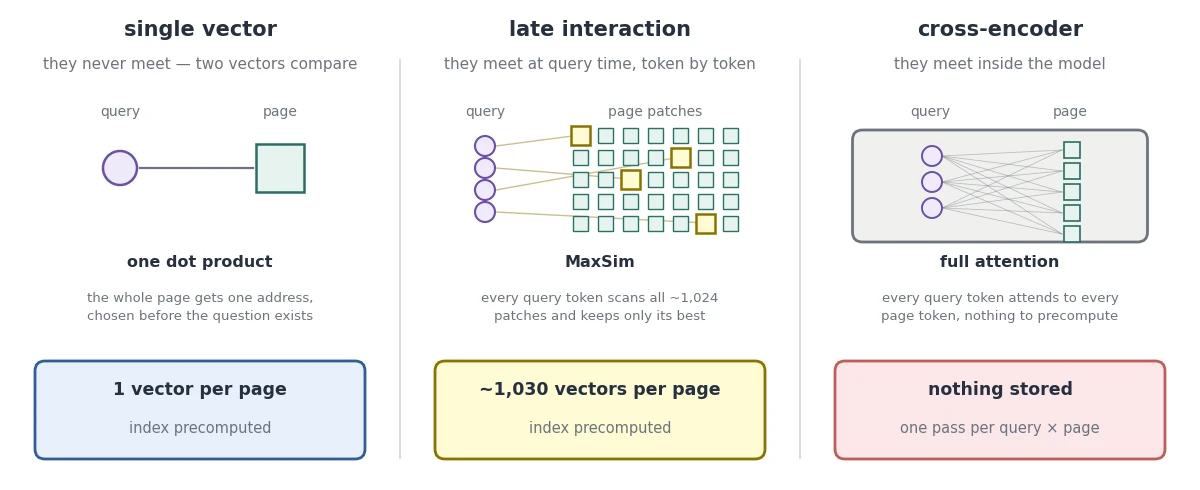 Late interaction buys a precomputable index and token-level matching at the same time. The thousand-odd vectors per page are the price of having both.
Layout survives for a more specific reason than the model sees a picture. The vision transformer chops the rendered page into a fixed 32×32 grid and attends across the whole grid before projecting each patch down, so spatial adjacency survives into the embeddings — the patch covering a bar’s top edge carries the axis label 400 pixels away. Linearization has to choose a reading order; a patch grid never chooses. The entire fragile ingestion layer goes with it: no table detection, no reading-order heuristics, no OCR fallback.
The cost is storage, and it is count-driven, not dimension-driven. ColPali’s vectors are smaller than a typical text embedding — 128 dimensions against 768 or more — there are simply about a thousand of them per page. Flat fp16 lands near 258 KB per page against roughly 6 KB for two text chunks, which is where the usual “fifty times” figure comes from. That number is the ceiling of a range rather than a property of the method: hierarchical pooling and int8 quantization are orthogonal to each other and compose, reaching around 7×.
The constraint is therefore architectural, not budgetary — which matters, because feasibility claims age badly and architectural ones do not. Late interaction prices itself out as a first-stage index, which is why credible deployments run it as a second stage: cheap recall over the whole corpus, MaxSim over fifty candidates, page images for the top five. Storage is not even the cost that bites first — MaxSim is a matrix multiply per candidate page, you want those vectors resident in RAM, and most embedded stores,
sqlite-vecincluded, have no native multi-vector scoring.
Stated plainly: you pay storage to avoid ever writing a chunker. The two architectures in the table above make the opposite trade — they keep the ingestion pipeline and spend on it — which is why the rest of this post is about making that spend pay off.
The multi-vector pattern
Store the transcription in the retrieval index, store the original image in a blob store, and link them by ID. Retrieval matches the text; the answering stage may fetch the image — or, if the transcription is faithful, skip it entirely.
1
2
3
4
5
6
CREATE TABLE chunks(
  id INTEGER PRIMARY KEY, doc_id TEXT, page INTEGER, text TEXT,
  type TEXT DEFAULT 'text',    -- 'text' | 'table' | 'image_transcript'
  source_ref TEXT,             -- s3://bucket/img/fig_042.png when type='image_transcript'
  transcriber_version TEXT     -- lets you re-transcribe selectively after a prompt change
);
The type column is what lets the query flow decide, per hit, whether pixels are needed. source_ref is the pointer that makes that decision actionable. Two enrichments pay for themselves immediately: prepend the document title and nearest heading to the transcription before embedding, since an image on its own has no context; and keep the page’s surrounding prose as metadata, since a figure’s caption often carries the terms a user will actually search with.
The cost analysis
Three buckets decide the architecture, and they pull in different directions. Getting this wrong is easy because the bucket that is easiest to measure is the one that matters least.
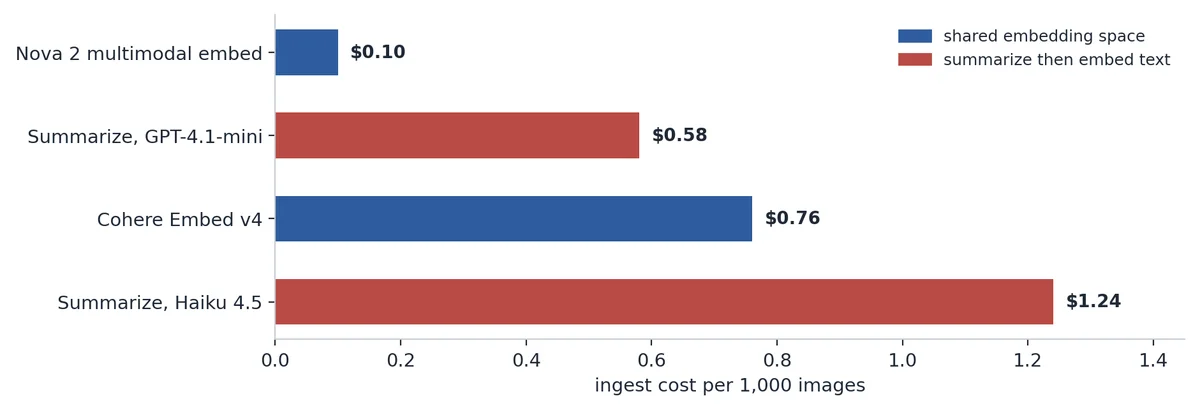
Shared-space embedding is the cheapest way in — which is exactly the trap.
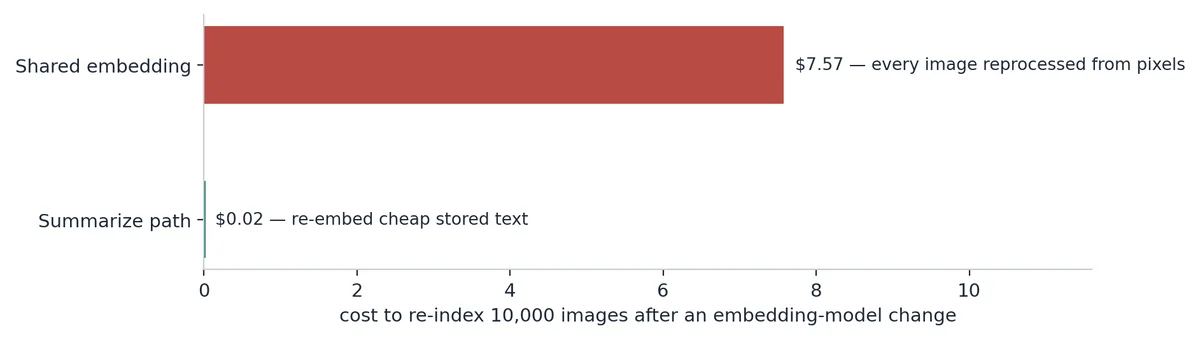 The reversal: the summarize path re-embeds stored text for pennies; the shared-space path reprocesses every image from pixels.
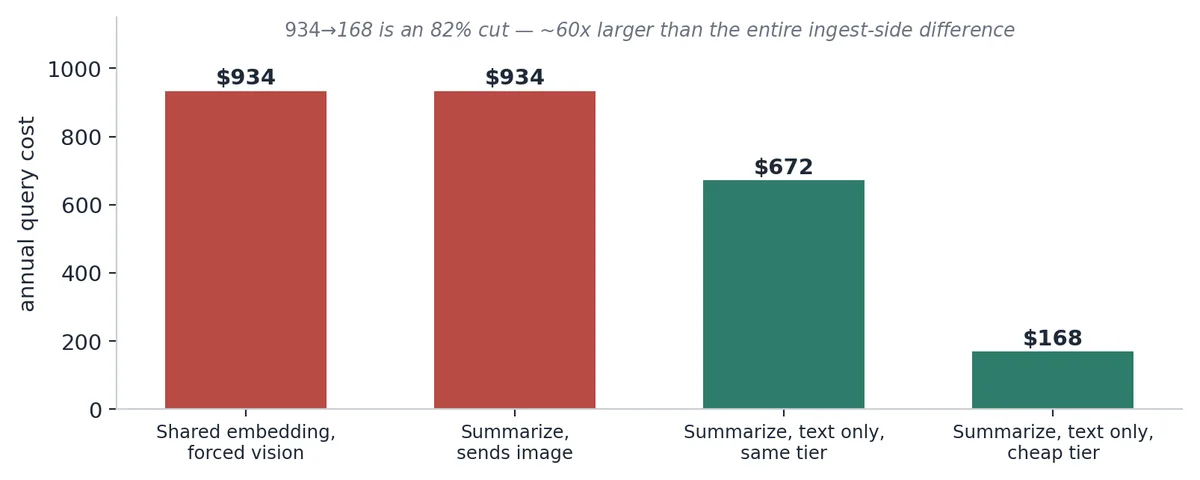 Mode choice at answer time dwarfs every ingest-side difference.
Read the three together. The shared-embedding path wins on ingest by roughly $0.50 per thousand images, then loses that back around sixtyfold on the query side — because retrieval-by-similarity gives the answering model no text to answer from. It must re-read the pixels on every single question, forever, at vision rates. Transcription costs more once, and in exchange makes the cheap text-only answering mode possible for the life of the system.
Optimize the recurring bucket, not the one-time one. This sounds obvious written down, and it is violated constantly, because ingest cost is the number you see during the prototype and query cost is the number you see after the system is load-bearing.
What a transcription cannot see
A transcription is lossy in a specific and predictable way: it preserves values and loses visual structure. Merged-cell hierarchies, footnote daggers, strikethrough, colour coding, spatial relationships in a diagram — none of that survives linearization.
| Question | Transcription sufficient? |
|---|---|
| “What is the on-demand rate for 32x?” | Yes — a value lookup |
| “Which tiers are grouped under ‘legacy pricing’?” | No — merged-cell hierarchy |
| “Which rows are struck through?” | No — pure formatting |
Hence a cascade rather than a fixed mode: answer from the transcription when it suffices, and fetch the image into a vision call when the question is about structure. A clean trigger is to let the answering model say so — “the transcription may not capture this; re-examining the original” — and treat that as the signal to escalate. It costs one extra hop on a small minority of queries and removes the entire class of confidently-wrong structural answers.
Chunking images
Vision models downsample large images to a fixed budget — roughly 1568 pixels on the longest edge for several current models, with similar caps elsewhere. A 4000-pixel-wide screenshot of a forty-row pricing table gets scaled to about 40% before the model looks at it. Nine-pixel text becomes an unreadable smear, and the model transcribes what it can guess.
The failure is silent, and worse than useless: the output looks like a plausible table, with plausible numbers, in the right shape.
| Strategy | When | Note |
|---|---|---|
| Send whole | Image already under the cap | Nothing to do |
| Tile with overlap | Uniformly dense content, big tables | ~15% overlap; re-stitch rows by header |
| Region crop | Mixed content, dashboards | Detect regions, crop, transcribe each |
| Downsample then re-crop | Sparse content | Cheap first pass; re-crop where text is small |
This is the chunking problem wearing different clothes: a fixed budget, content that exceeds it, and a dumb cut that destroys meaning at the boundary. Overlap plays the same role as prose overlap. Region cropping is block-boundary segmentation. Re-stitching by header is the repeated-header rule. A table row cut in half by a tile boundary is precisely the mid-row cut from part 3 — same failure, different medium.
The practical consequence is that you should measure the pixel dimensions of every image at ingest and log the distribution, the same way you log chunk lengths. A corpus where 5% of images exceed the vision cap is a corpus where 5% of your image transcriptions are fiction, and no metric downstream will tell you which 5%.
What comes next
The next post covers the two retrieval failures that no amount of better chunking or better reranking can fix — and the entity and graph machinery that does.
References
- Ofer Mendelevitch and Forrest Sheng Bao, Hands-On RAG for Production, O’Reilly Media, 2026
- Faysse et al., ColPali: Efficient Document Retrieval with Vision Language Models, ICLR 2025
- Radford et al., Learning Transferable Visual Models From Natural Language Supervision (CLIP), ICML 2021
- LangChain multi-vector retriever documentation